Looking to give a memorable chronobiology-inspired gift to a student or colleague that’s leaving lab? What’s better than an actogram based on their own data that they can put up on the wall?
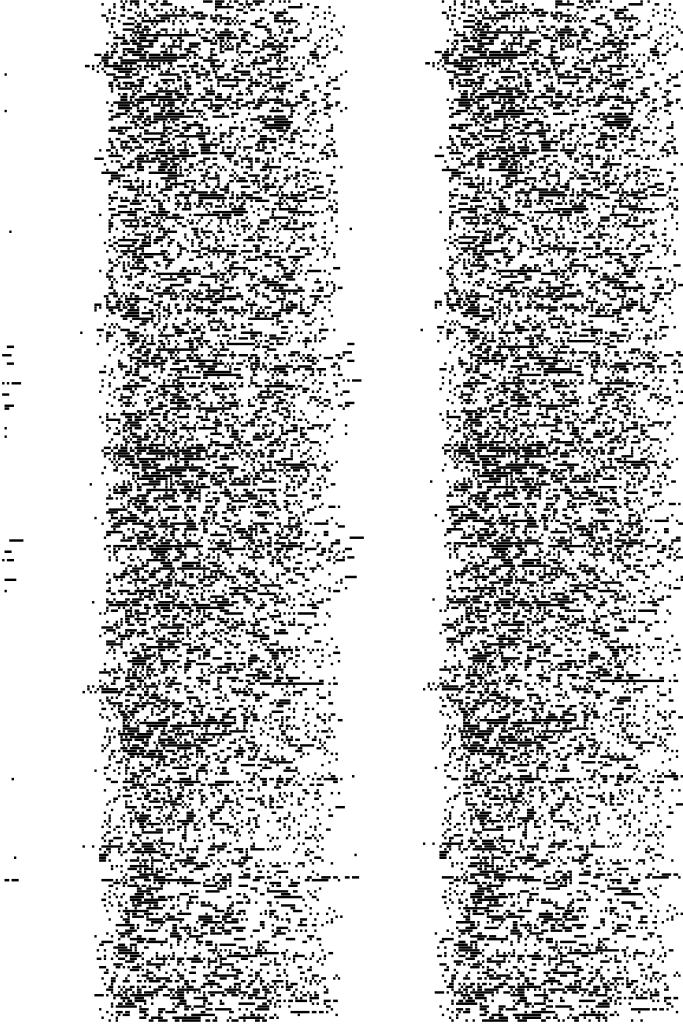
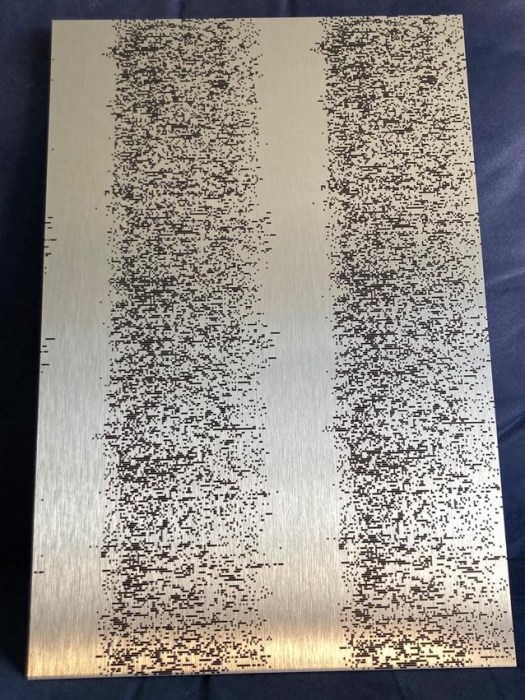
Here’s an example of what I recently made for a graduate student who had finished her thesis, based on her own step count data collected by her iPhone. It was printed on aluminum and we were quite pleased with the result! In this post I’m sharing how to make such an actogram yourself based on iPhone Health data, including the R code to process the data and make the actogram. The R code was written to work with iPhone Health data but the code can be modified so it works with any step count or other activity data. Very basic knowledge of R is probably helpful but it really should be self-explanatory.
- First step is getting hold of the person’s iPhone data – unfortunately I cannot help you with that but the most simple and ethical way is just asking for it. If you want to keep the gift a surprise, this is probably the most tricky part, especially since the rest of the steps are very easy. Apple Health data can be exported as an XML file as follows:
- On the iPhone go to the Health App -> Profile -> Export data -> select one of the sharing options. You’ll get a .zip file that contains an XML file called Export.xml.
- Extract the XML file to a folder on your computer.
- Make sure you have R and RStudio running on your computer. See instructions here: https://www.datacamp.com/tutorial/installing-R-windows-mac-ubuntu
- Use the script ‘apple-actogram-gift.R’ in this github repository and make the following changes:
- In Line 20, change ‘XYZ’ to the name of the person.
- In line 25-26, specify the desired start & end dates (depending on the availability of the data). I used one year of data to create the actogram, which looked good, but you can also play around with shorter or longer durations and see what the result looks like.
- Line 28: specify the time zone in which the data was collected. A list of abbreviations can be found here: https://en.wikipedia.org/wiki/List_of_tz_database_time_zones#Time_Zone_abbreviations
- Line 31: specify the location of the export.xml file, so R knows where to find it (or use an R project file).
- Make sure the required packages (line 15-17) are installed. Otherwise, first run install.packages(c(“tidyverse”, “lubridate”, “XML”)).
- Run the entire script. The actogram is saved as a PDF and PNG in your working directory.
- If you intend to give the actogram as a gift, look for a local shop that can print the actogram on canvas, wood, aluminum, or any other medium.
- I would love to see the final result, so please send a picture to laurakervezee [at] gmail [dot] com if you end up using this script.
