I enjoy organizing public outreach events that allow people to learn about their biological clock. It’s always a lot of fun and very inspiring to do these type of activities and talk to people about circadian biology. The great thing about circadian biology is that it’s such an easy topic to talk about with other people, as it directly impacts everyone’s daily lives and most people are naturally interested in how their own body works.
On this page I give you an idea for an interactive outreach activity that our group has successfully organized many times. It’s a quick activity, suitable for a range of target groups (from kids to older people), and ideal for science days, workshops, festivals, at the end of a public lecture, or other events with many people passing by. The more the better, as you will see!
I have used this activity during workshops at multiple events, such as the National Weekend of Science in Amsterdam, Night of the Museums in Leiden, Betweterfestival in Utrecht, Night of Discoveries in Leiden, and even in front of the restaurant in the hospital we work in. Feel free to use it or adapt it for your own outreach event although it would be fun if you let me know at l.kervezee [at] lumc [dot] nl.
What to bring with you:
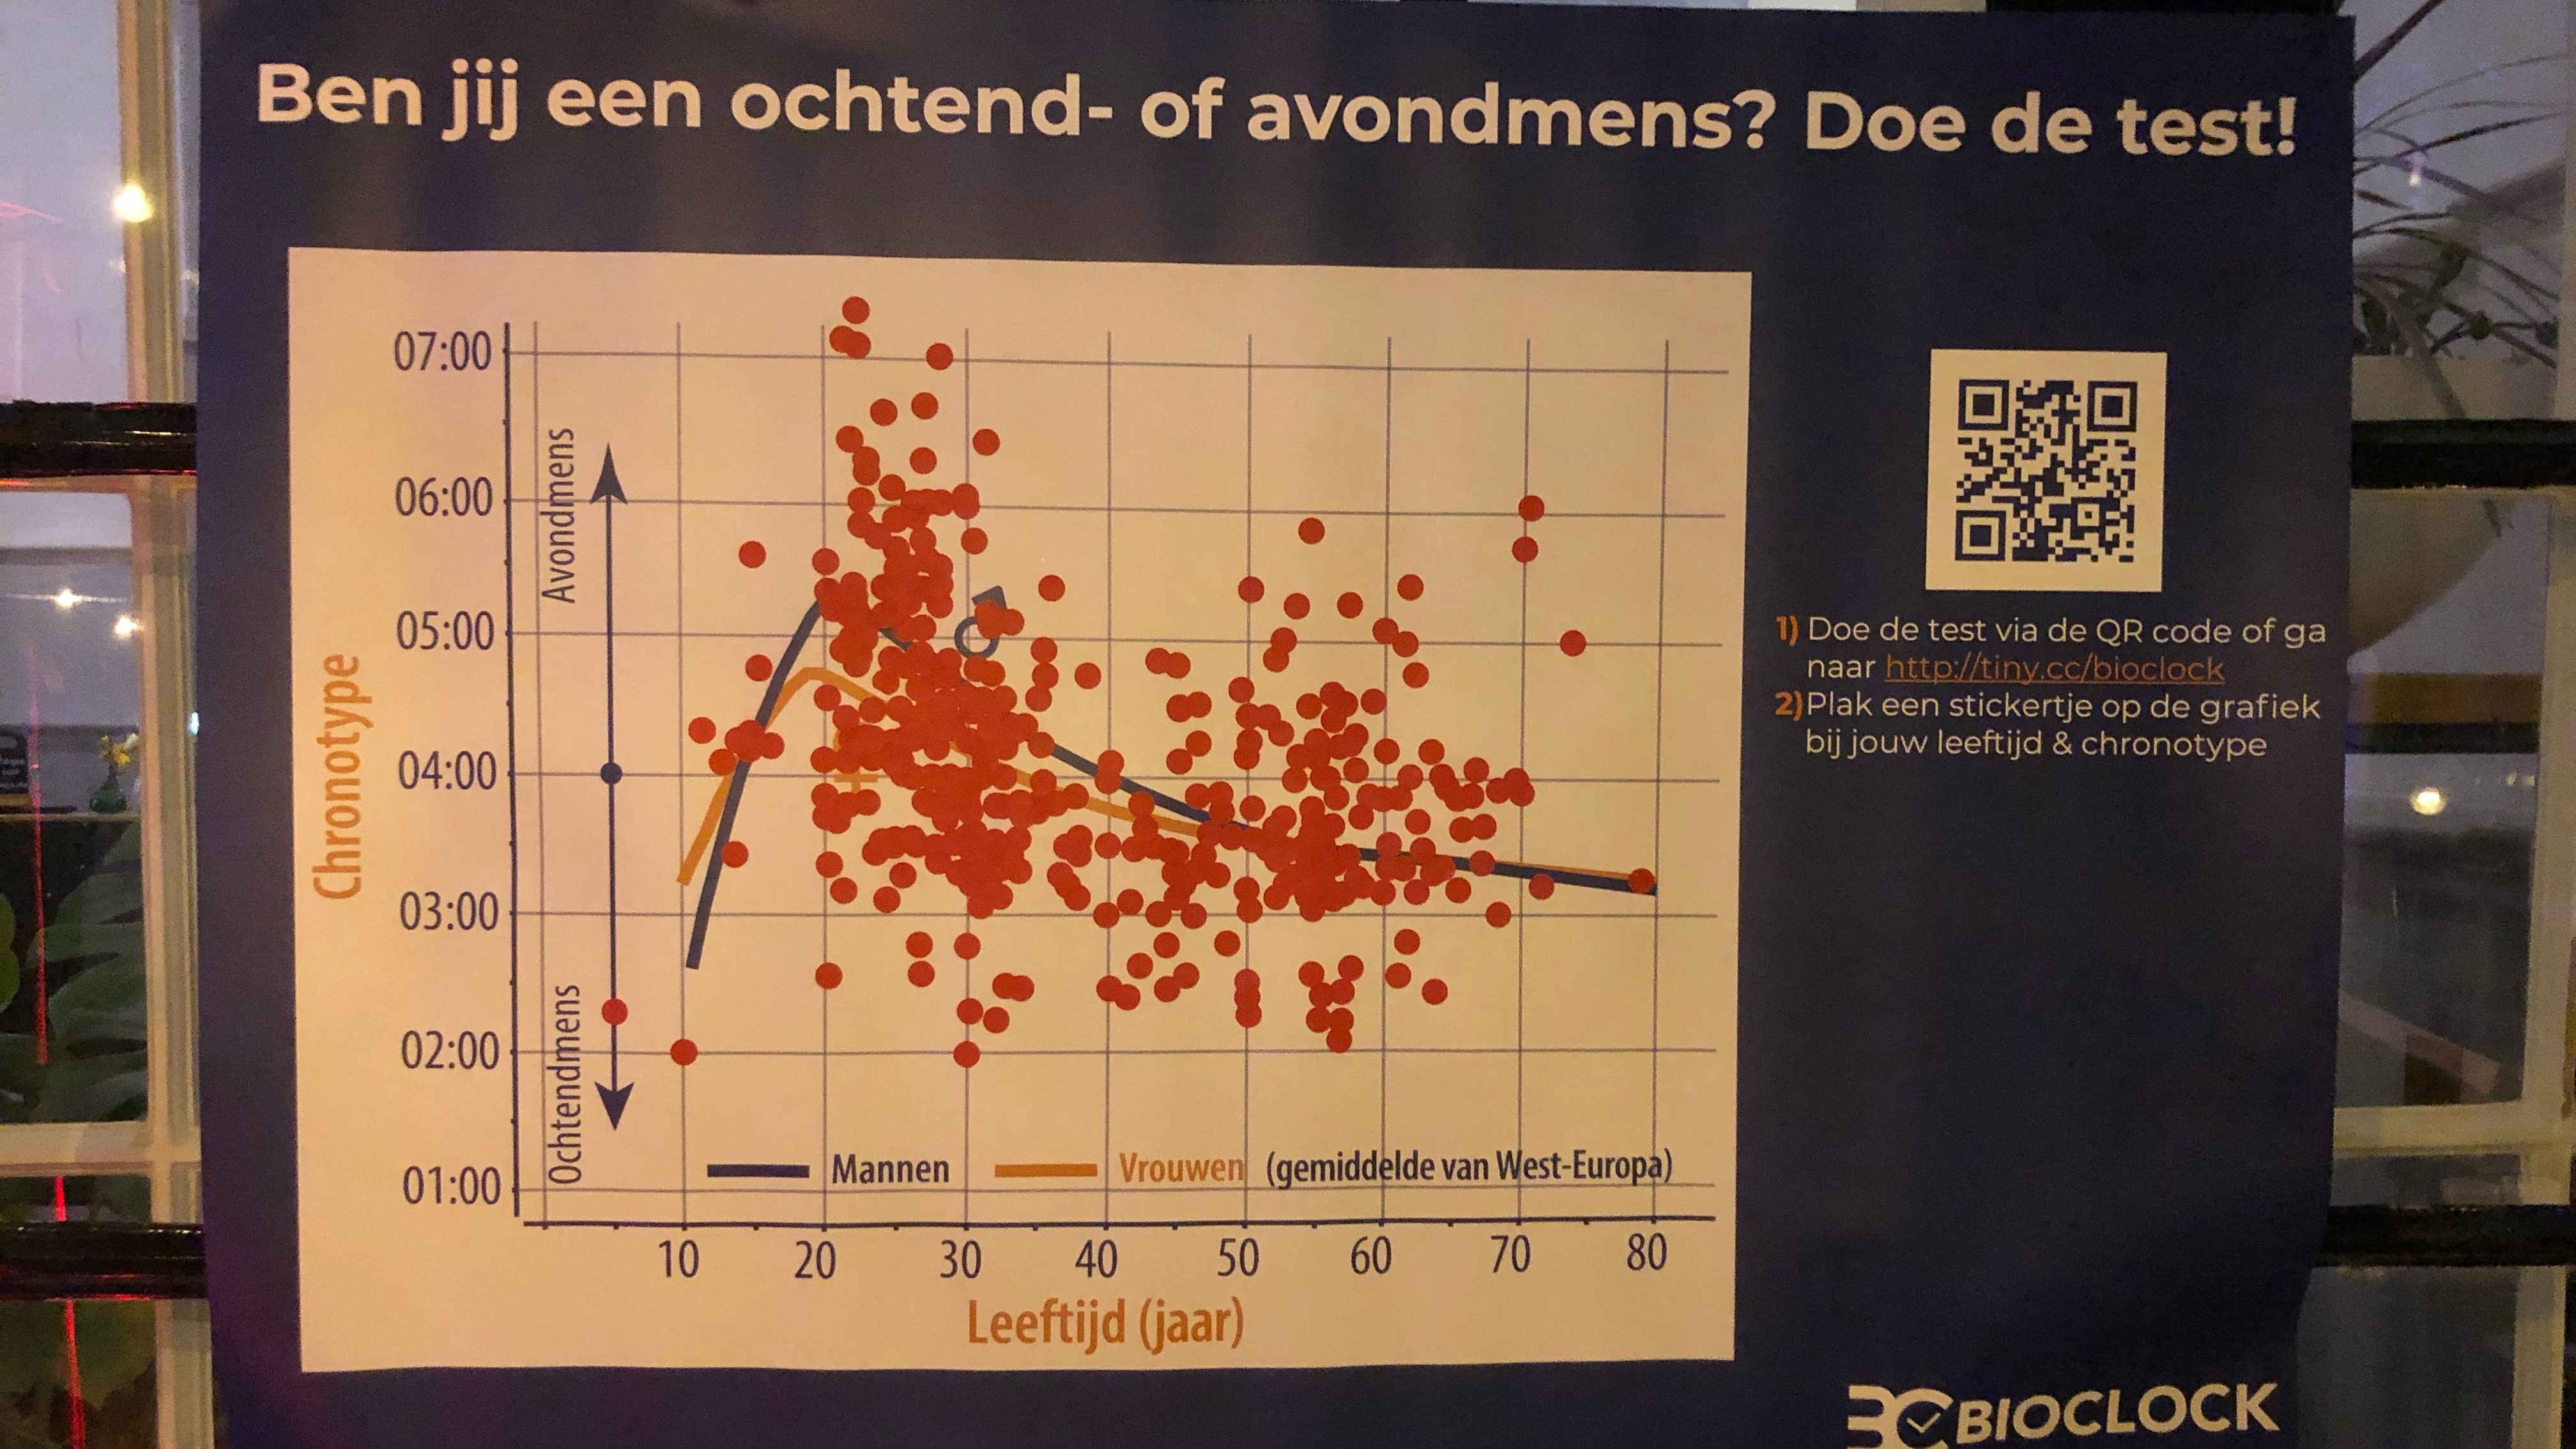
- A large print-out of this poster, e.g. on A0 size (84 x 118 cm). The graph is based on this publication.
- Colored stickers (round). You could use different colors to visualize the sex difference in chronotype but I always let the participants pick whatever sticker they wanted. I have also used smiley stickers in a workshop with kids (it turned out that the adults liked them too).
- Optional: a tablet or another device that can be used to access the chronotype app. Alternatively, people can use their own smartphone to scan the QR code and go to the app (this is the option I usually go for).
Description:
In this activity, participants scan the QR code on the poster to get to know their chronotype. The QR code refers to an app that’s based on the short version of the Munich Chronotype Questionnaire (μMCTQ, see Ghotbi et al., 2020). Based on six short questions, the app will show their chronotype (a clock time), an interpretation (i.e. whether they are an early, intermediate, or late type relative to their age group), and the amount of social jetlag they experience each week. Next, they will take a sticker and put it on the poster (see photo) at the intersection of their age on the x-axis and their chronotype of the y-axis.
In principle it’s a very short activity; people don’t need a lot of time to complete the questionnaire and add their sticker to the poster. However, it’s of course up to you to talk to the participants about their result and what it means. If you have people do the questionnaire at the end of a public lecture, you can of course discuss chronotype, social jetlag, and the relationship between age, sex, and chronotype in your talk. If it’s a stand-alone activity, people might need a bit more explanation about their results, where to put the sticker, and what this all means, but that’s why you’re there. You can read more about the activity in this document, including answers to some of the most frequently asked questions by participatns
I have had a lot of fun with this activity so that’s why I wanted to share it (under a CC BY 4.0 license). If you’re looking for an interactive element in a public outreach event, feel free to use this as an inspiration. It sparks people’s interest in chronobiology and at the same time also helps to improve their graph literacy, as they put their results as a data point in a graph and learn about the relationship between age and chronotype. Especially younger kids might need some guidance with the placement of the sticker, but just getting to place a sticker on the poster is often all it takes to make them happy.
As a final note, I have always used this activity for purely educational purposes, not for research purposes, based on various publications (Ghotbi et al., 2020, J Biol Rhythms; Roenneberg et al., 2012, Curr Biol; Roenneberg et al., 2019, Biology), and checked the calculations thoroughly, but if you discover a mistake or have suggestions for improvement, please let me know. The app does not collect any data or store any input.

