Phase response curves (PRC) are an important concept in chronobiology but it can be tricky for students to really understand them. I designed this hands-on activity for an undergraduate course on chronobiology to have the students (about 20 of them) get practical experience with constructing a PRC and hopefully help them grasp the concept. I’m sure others have used a similar exercise in their classes but I still wanted to share it in case it’s useful to anyone. If you have any questions or comments, contact me at laurakervezee [at] gmail [dot] com.
Preparation
Ask students to bring a pencil and ruler to class. It’d also help if you already introduced circadian entrainment, delays, advances, and PRCs to your students during a lecture or as self-study. A good resource is the BioClock Studio page on chronobiology basics from dr. Susan Golden and the associated YouTube movie on PRCs.
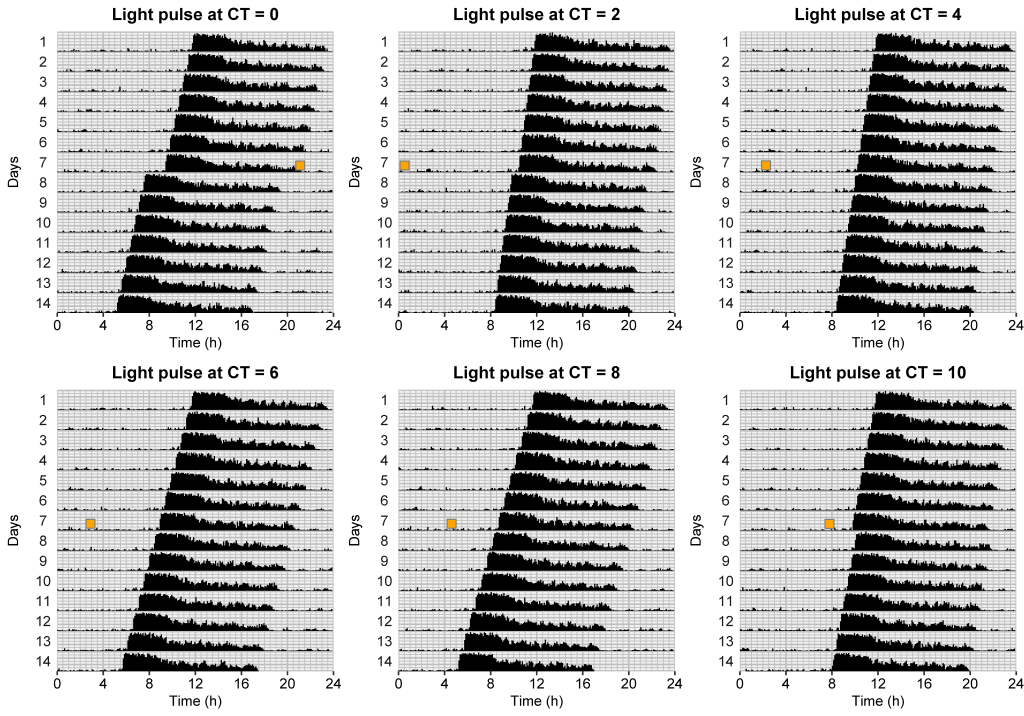
Bring print-outs of these actograms and this empty PRC graph to class (e.g. one for each pair of students). The actograms are based on simulated data from a hypothetical mouse and are only intended for educational purposes.

Description
In class, ask the students to work in pairs. I typically give minimal instructions but rather let students find out by themselves how to draw the PRC on the plot on the right, based on the data on the left, using their pencil and ruler. After a lecture on circadian rhythms and entrainment, during which I also showed a PRC, this was sufficient information for the students to figure it out. Some pairs were quicker than others of course, and in the end they all helped each other; a good example of peer-to-peer learning I guess :-). The result was 10 beautifully hand-drawn PRCs, similar to this. After they had all finished, I discussed the results with the entire group.
